Mock spent nuclear fuel canister calculations were performed with both the deterministic Attila solver and MCNP® using Attila4MC (referred to herein as Attila4MC). The canister contained representative subcritical neutron and gamma sources simulating spent nuclear fuel. Fission was accounted for in the subcritical assembly, and secondary gamma sources calculated from neutron capture and inelastic scatter were also transported. Dose results were generated at various point locations inside and outside of the canister. Results from a legacy CSG (constructed surface geometry) MCNP calculation were included in the comparison to validate the unstructured mesh results.
Figure 1 illustrates a 90° cutout of the canister geometry. The neutron source is applied to the 360.17 cm high cylindrical homogenized spent fuel region (1). Above the spent fuel region is a 29.77 cm thick plenum (2), followed by a 19.98 cm thick homogenized top end fitting (TEF) (3). Below the fuel is a 10.77 cm thick homogenized bottom end fitting (BEF) (4). Regions (1) through (4) are all cylinders with a radius of 83.82 cm. A 0.635 cm thick stainless-steel liner (5) fully encompasses the canister.
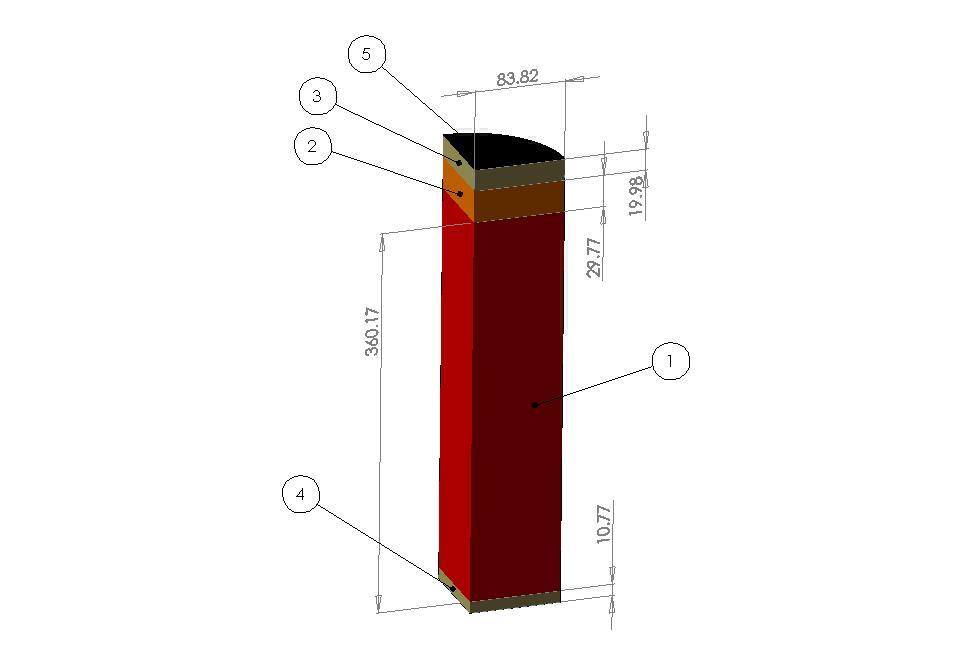
Figure 1. 90° cutout of the canister geometry, including: (1) spent fuel region, (2) plenum, (3) TEF, (4) BEF, and (5) 0.635 cm thick stainless-steel liner. All dimensions are in cm.
The canister was centered in a void cylinder (h = 900 cm, d = 600 cm). Figure 2 presents the relative locations of the measurement (edit) points where results were compared. Coordinates of these points are provided in Table 1.
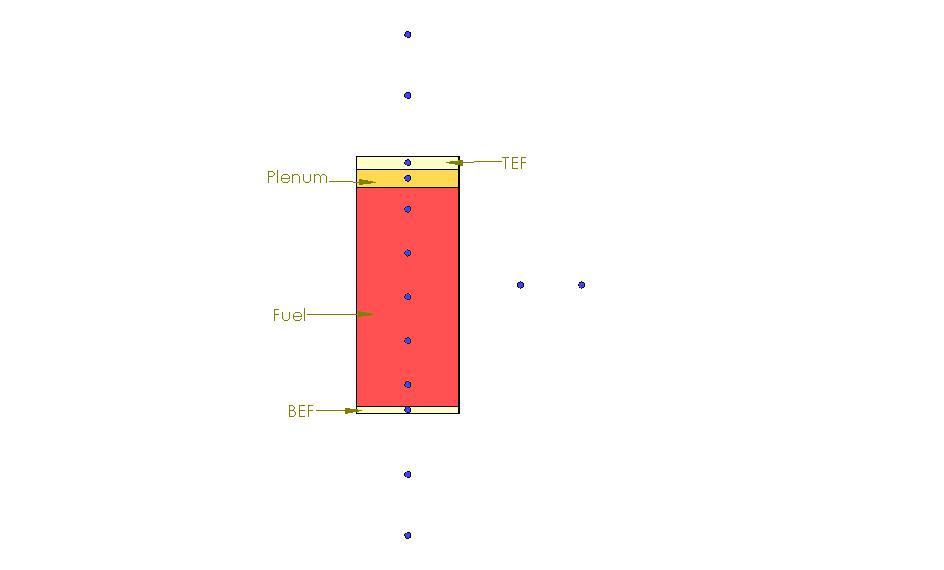
Figure 2: Canister geometry, coordinate system triad, and relative location of solution edit points (blue)

Table 1. Location Coordinates (cm) of Dose Measurement Points
The modeled source, consisting of both neutrons and gammas, represents a homogenized PWR assembly with 5% initial enrichment after an 80 GW-d MTU-1 burn-up cycle and 5 years of cooling. The primary neutron source, described in Table 2, is distributed uniformly throughout the homogenized spent fuel region.
Table 2. Primary Neutron Source (Fuel Region) Information

The primary gamma source, described in Table 3, is located in the BEF, fuel, plenum, and TEF regions.

Table 3. Primary Gamma Source Information by Region
Note that the source information values in Tables 2 and 3 are equivalent to the spectrum values of the PWR max source spectra in the Attila Project files taking into account the conversion factors listed in the Info tab of the source spectra. For MCNP, these values are identical to those in the Source Information (si) and Source Probability (sp) Cards in the input deck.
Two separate calculation types are to be performed for deterministic Attila, Attila4MC, and MCNP-CSG: (1) a coupled neutron-gamma calculation using the primary neutron source, allowing for fission and neutron capture creating secondary gamma sources and transport of the secondary gammas; and (2) a gamma calculation from the primary gamma source. Although these calculations can be performed using a single calculation in either Attila/Attila4MC or MCNP, separate calculations were designed to isolate the contribution to the total gamma dose from the secondary gammas created from neutron capture.
The computational mesh contains approximately 47383 elements. All 47 energy groups of the Radion15 cross section set (22 neutron, 25 gamma) are assigned for deterministic Attila in the coupled neutron-gamma calculation, and all 25 gamma groups are assigned in the primary gamma calculation. In both Attila calculations, an SN order of 18 and a Pn order of 3 are used.
A flux-to-dose conversion factor is used for Attila, Attila4MC, and MCNP-CSG to obtain dose rate results in units of rem h-1. Attila results are calculated at points without and with the use of the last-collided method, which semi-analytically transports the last scattered flux to the associated edit points. The last-collided method is not applied to measurement points (edits) inside of the source, as this is expected to be a high scattering region. Table 4 shows which calculations provide results for the various calculation methods. Attila-No LC are calculations in which the last collided method (LC) is not applied.

Table 4. Calculation File Index
Contour plots of the dose rate (rem h-1) for the primary neutron and secondary gamma calculations using Attila are provided in Figure 3, and Figure 4 displays the primary gamma contour plot using Attila.
Figure 3. Contour plots of the dose rate (rem h-1) in the X-plane for the primary neutron (a) and secondary gamma (b) calculations.
Figure 4. Contour plot of the dose rate (rem h-1) in the X-plane for the primary gamma calculation.
Tables 5 and 6 show dose rate results for point detectors using the four calculations methods (Attila-No LC, Attila-LC, Attila4MC, and MCNP-CSG) for the primary neutron and secondary gamma calculation types, respectively. The Point (Edit) # is identical to the information listed in Table 1. For reference, the table is divided by location relative to the canister. All calculations were run to convergence with a relative error of less than 5% (5.00E+07 histories). Note that this calculation will take an extended period of time. Results can be obtained by running fewer histories. Ratios of Attila-No LC, Attila-LC, and MCNP-CSG to Attila4MC (Calculation Method/Attila4MC) results are included.
Table 5. Primary Neutron Point Detector Dose Rate Results (rem h-1) with Relative Errors and Calculation Ratios
Table 6. Secondary Gamma Point Detector Dose Rate Results (rem h-1) with Relative Errors and Calculation Ratios
Table 7 shows the dose rate results for the primary gamma calculation type, and is structured identically to Tables 5 and 6.
Table 7. Primary Gamma Point Detector Dose Rate Results (rem h-1) with Relative Errors and Calculation Ratios